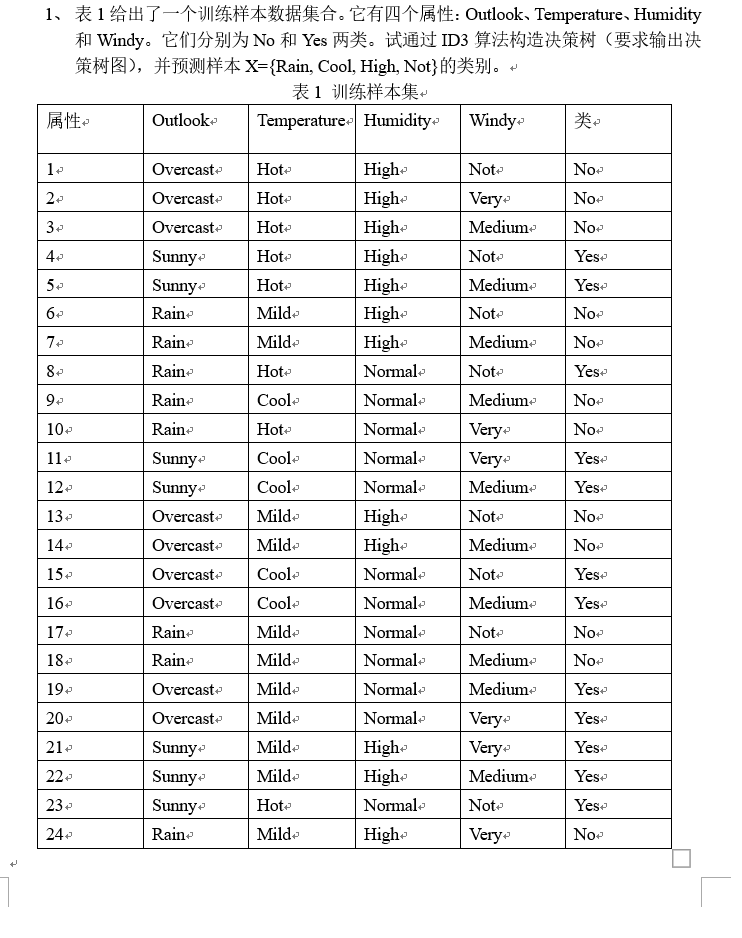
ID3实现决策树

总结课上讲的决策树基本概念以及采用ID3算法实现决策树

概念

决策树

决策树是一种类似于流程图的数结构,其中每个内部节点表示在一个属性上的测试,每个分支代表该测试的一个输出,每一个叶节点存放一个类标号,最顶层是根节点。

此段原文链接

事实上,熵的英文原文为entropy,最初由德国物理学家鲁道夫·克劳修斯提出,其表达式为:entropy,它表示一个系系统在不受外部干扰时,其内部最稳定的状态。后来一中国学者翻译entropy时,考虑到entropy是能量Q跟温度T的商,且跟火有关,便把entropy形象的翻译成“熵”。我们知道,任何粒子的常态都是随机运动,也就是”无序运动”,如果让粒子呈现”有序化”,必须耗费能量。所以,温度(热能)可以被看作”有序化”的一种度量,而”熵”可以看作是”无序化”的度量。如果没有外部能量输入,封闭系统趋向越来越混乱(熵越来越大)。比如,如果房间无人打扫,不可能越来越干净(有序化),只可能越来越乱(无序化)。而要让一个系统变得更有序,必须有外部能量的输入。1948年,香农Claude E. Shannon引入信息(熵),将其定义为离散随机事件的出现概率。一个系统越是有序,信息熵就越低;反之,一个系统越是混乱,信息熵就越高。所以说,信息熵可以被认为是系统有序化程度的一个度量。

熵越大,就意味着混杂度越大,越难以区分,因此决策树要选取熵小的作为根节点

公式:
entropy(S)=$\sum_{i=0}^N {Pi*\log_2 Pi}$


Pi为概率

信息增益

用来衡量熵的期望减少值
分类前的信息熵减去分类后的信息熵

公式:gain(S,A)=entropy(S)-entropy(S,A)

信息增益越大,熵的减小量越大,节点更纯

entropy(S,A)含义:

设属性A将S划分为m份,根据A划分的子集的熵或期望信息

entropy(S,A)=$\sum_{i=0}^m {|Si| \over |S|}*entropy(Si)$

(Si表示根据属性A划分的S的第i个字集,|S|和|Si|分别表示S中,Si中的样本数目)

构建决策树

代码实现(原文链接)

建树

1
2
3
4
5
6
7
8
9
10
11
12
13
14
15
16
17
18
19
20
21
22
23
24
25
26
27
28
29
30
31
32
33
34
35
36
37
38
39
40
41
42
43
44
45
46
47
48
49
50
51
52
53
54
55
56
57
58
59
60
61
62
63
64
65
66
67
68
69
70
71
72
73
74
75
76
77
78
79
from math import log
import operator

# 计算信息熵
def calcShannonEnt(dataSet):
numEntries = len(dataSet) # 样本数
labelCounts = {}
for featVec in dataSet: # 遍历每个样本
currentLabel = featVec[-1] # 当前样本的类别
if currentLabel not in labelCounts.keys(): # 生成类别字典
labelCounts[currentLabel] = 0
labelCounts[currentLabel] += 1
shannonEnt = 0.0
for key in labelCounts: # 计算信息熵
prob = float(labelCounts[key]) / numEntries
shannonEnt = shannonEnt - prob * log(prob, 2)
return shannonEnt


# 划分数据集,axis:按第几个属性划分,value:要返回的子集对应的属性值
def splitDataSet(dataSet, axis, value):
retDataSet = []
featVec = []
for featVec in dataSet:
if featVec[axis] == value:
reducedFeatVec = featVec[:axis]
reducedFeatVec.extend(featVec[axis + 1:])
retDataSet.append(reducedFeatVec)
return retDataSet


# 选择最好的数据集划分方式
def chooseBestFeatureToSplit(dataSet):
numFeatures = len(dataSet[0]) - 1 # 属性的个数
baseEntropy = calcShannonEnt(dataSet)
bestInfoGain = 0.0
bestFeature = -1
for i in range(numFeatures): # 对每个属性技术信息增益
featList = [example[i] for example in dataSet]
uniqueVals = set(featList) # 该属性的取值集合
newEntropy = 0.0
for value in uniqueVals: # 对每一种取值计算信息增益
subDataSet = splitDataSet(dataSet, i, value)
prob = len(subDataSet) / float(len(dataSet))
newEntropy += prob * calcShannonEnt(subDataSet)
infoGain = baseEntropy - newEntropy
if (infoGain > bestInfoGain): # 选择信息增益最大的属性
bestInfoGain = infoGain
bestFeature = i
return bestFeature

def majorityCnt(classList):
classCount = {}
for vote in classList:
if vote not in classCount.keys(): classCount[vote] = 0
classCount[vote] += 1
sortedClassCount = sorted(classCount.iteritems(),
key=operator.itemgetter(1), reverse=True)
return sortedClassCount[0][0]


# 递归构建决策树
def createTree(dataSet, labels):
classList = [example[-1] for example in dataSet] # 类别向量
if classList.count(classList[0]) == len(classList): # 如果只有一个类别,返回
return classList[0]
if len(dataSet[0]) == 1: # 如果所有特征都被遍历完了,返回出现次数最多的类别
return majorityCnt(classList)
bestFeat = chooseBestFeatureToSplit(dataSet) # 最优划分属性的索引
bestFeatLabel = labels[bestFeat] # 最优划分属性的标签
myTree = {bestFeatLabel: {}}
del (labels[bestFeat]) # 已经选择的特征不再参与分类
featValues = [example[bestFeat] for example in dataSet]
uniqueValue = set(featValues) # 该属性所有可能取值,也就是节点的分支
for value in uniqueValue: # 对每个分支,递归构建树
subLabels = labels[:]
myTree[bestFeatLabel][value] = createTree(
splitDataSet(dataSet, bestFeat, value), subLabels)
return myTree

画图

1
2
3
4
5
6
7
8
9
10
11
12
13
14
15
16
17
18
19
20
21
22
23
24
25
26
27
28
29
30
31
32
33
34
35
36
37
38
39
40
41
42
43
44
45
46
47
48
49
50
51
52
53
54
55
56
57
58
59
60
61
62
63
64
65
66
67
68
69
70
71
72
73
74
75
76
77
78
79
80
81

import matplotlib.pyplot as plt

# 定义文本框和箭头格式
decisionNode = dict(boxstyle="round4", color='#3366FF') #定义判断结点形态
leafNode = dict(boxstyle="circle", color='#FF6633') #定义叶结点形态
arrow_args = dict(arrowstyle="<-", color='g') #定义箭头

#绘制带箭头的注释
def plotNode(nodeTxt, centerPt, parentPt, nodeType):
createPlot.ax1.annotate(nodeTxt, xy=parentPt, xycoords='axes fraction',
xytext=centerPt, textcoords='axes fraction',
va="center", ha="center", bbox=nodeType, arrowprops=arrow_args)


#计算叶结点数
def getNumLeafs(myTree):
numLeafs = 0
firstStr = list(myTree.keys())[0]
secondDict = myTree[firstStr]
for key in secondDict.keys():
if type(secondDict[key]).__name__ == 'dict':
numLeafs += getNumLeafs(secondDict[key])
else:
numLeafs += 1
return numLeafs


#计算树的层数
def getTreeDepth(myTree):
maxDepth = 0
firstStr = list(myTree.keys())[0]
secondDict = myTree[firstStr]
for key in secondDict.keys():
if type(secondDict[key]).__name__ == 'dict':
thisDepth = 1 + getTreeDepth(secondDict[key])
else:
thisDepth = 1
if thisDepth > maxDepth:
maxDepth = thisDepth
return maxDepth


#在父子结点间填充文本信息
def plotMidText(cntrPt, parentPt, txtString):
xMid = (parentPt[0] - cntrPt[0]) / 2.0 + cntrPt[0]
yMid = (parentPt[1] - cntrPt[1]) / 2.0 + cntrPt[1]
createPlot.ax1.text(xMid, yMid, txtString, va="center", ha="center", rotation=30)


def plotTree(myTree, parentPt, nodeTxt):
numLeafs = getNumLeafs(myTree)
depth = getTreeDepth(myTree)
firstStr = list(myTree.keys())[0]
cntrPt = (plotTree.xOff + (1.0 + float(numLeafs)) / 2.0 / plotTree.totalW, plotTree.yOff)
plotMidText(cntrPt, parentPt, nodeTxt) #在父子结点间填充文本信息
plotNode(firstStr, cntrPt, parentPt, decisionNode) #绘制带箭头的注释
secondDict = myTree[firstStr]
plotTree.yOff = plotTree.yOff - 1.0 / plotTree.totalD
for key in secondDict.keys():
if type(secondDict[key]).__name__ == 'dict':
plotTree(secondDict[key], cntrPt, str(key))
else:
plotTree.xOff = plotTree.xOff + 1.0 / plotTree.totalW
plotNode(secondDict[key], (plotTree.xOff, plotTree.yOff), cntrPt, leafNode)
plotMidText((plotTree.xOff, plotTree.yOff), cntrPt, str(key))
plotTree.yOff = plotTree.yOff + 1.0 / plotTree.totalD


def createPlot(inTree):
fig = plt.figure(1, facecolor='white')
fig.clf()
axprops = dict(xticks=[], yticks=[])
createPlot.ax1 = plt.subplot(111, frameon=False, **axprops)
plotTree.totalW = float(getNumLeafs(inTree))
plotTree.totalD = float(getTreeDepth(inTree))
plotTree.xOff = -0.5 / plotTree.totalW;
plotTree.yOff = 1.0;
plotTree(inTree, (0.5, 1.0), '')
plt.show()

测试

1
2
3
4
5
6
7
8
9
10
11
12
def classify(inputTree, featLabels, testVec):
firstStr = list(inputTree.keys())[0] # 根节点
secondDict = inputTree[firstStr]
featIndex = featLabels.index(firstStr) # 跟节点对应的属性
classLabel = None
for key in secondDict.keys(): # 对每个分支循环
if testVec[featIndex] == key: # 测试样本进入某个分支
if type(secondDict[key]).__name__ == 'dict': # 该分支不是叶子节点,递归
classLabel = classify(secondDict[key], featLabels, testVec)
else: # 如果是叶子, 返回结果
classLabel = secondDict[key]
return classLabel

主函数执行

1
2
3
4
5
6
7
8
9
10
11
12
13
14
15
16
17
import json
import csv
def load_data(filename):
lines = csv.reader(open(filename, "rt",encoding='utf-8-sig'))
dataset = list(lines)
return dataset

filename="G:/学习/课程相关/大三/大数据挖掘/上机/4/thisdata.csv"
listWm = load_data(filename)
labels = ['Outlook', 'Temperature', 'Humidity', 'Windy']
Trees = createTree(listWm, labels)
createPlot(Trees)
labels = ['Outlook', 'Temperature', 'Humidity', 'Windy']
testData = ['Rain', 'Cool', 'High', 'Not']
testClass = classify(Trees, labels, testData)
print(testClass)


输出结果:No


ID3实现决策树
https://shanhainanhua.github.io/2019/10/23/ID3实现决策树/
作者
wantong
发布于
2019年10月23日
许可协议